LIV Golf Digital Design Intern
The rundown
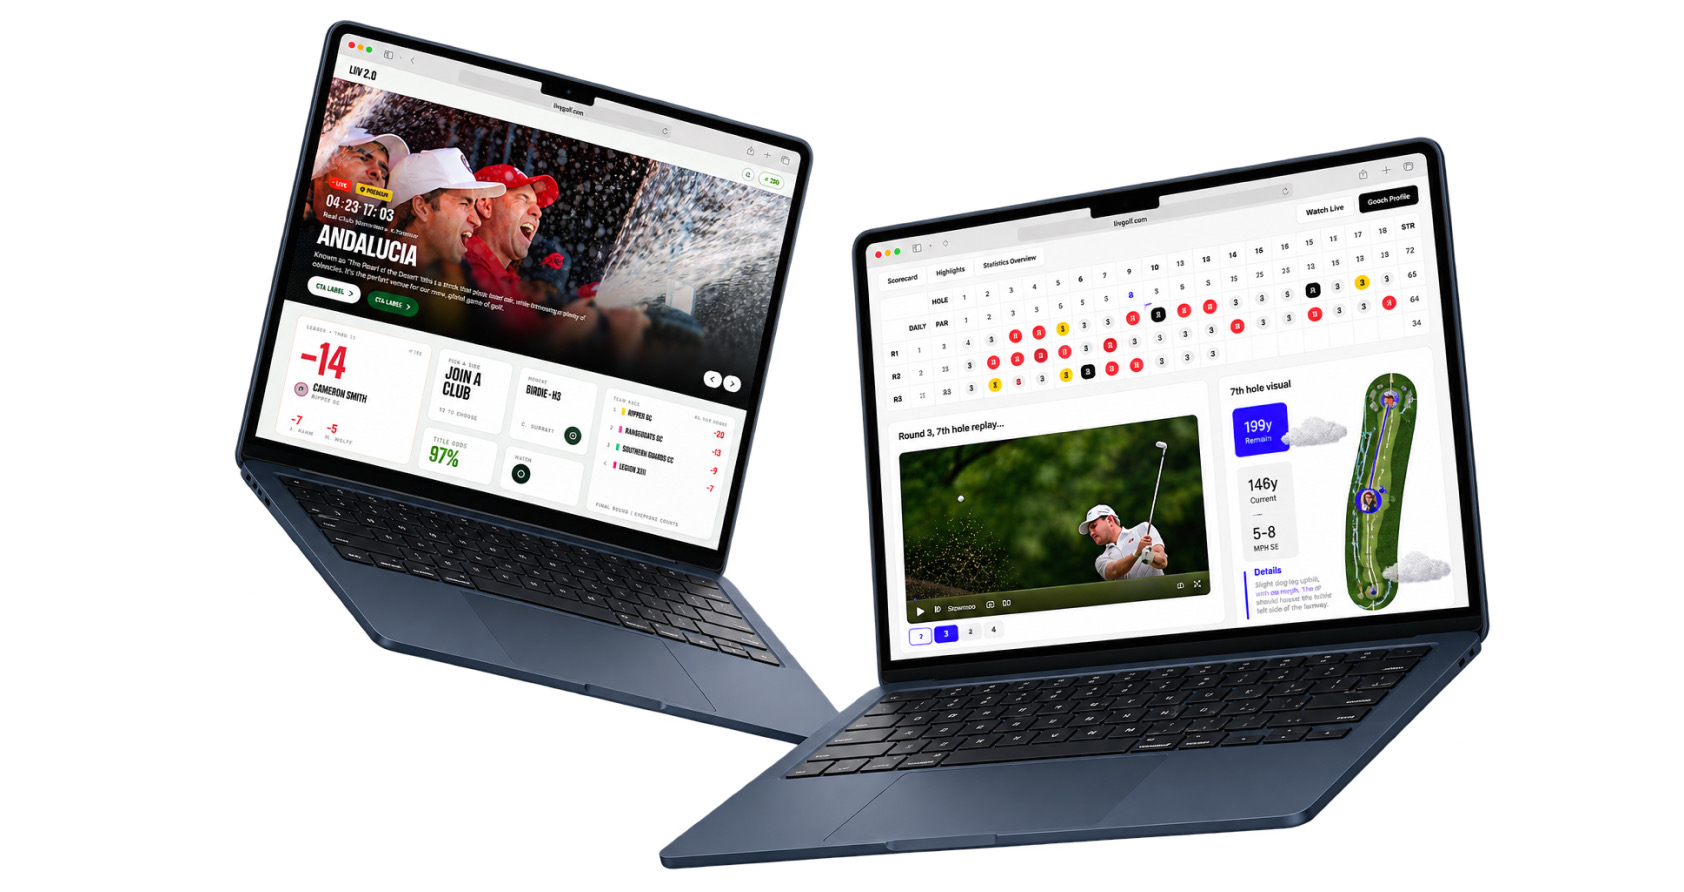
I joined LIV Golf at an uncertain time for the company. That uncertainty ended up working in my favor. It gave me room to take on more than an intern usually does. I left with lessons not just in design, but in how I collaborate across a product team, and in how a corporate organization actually operates.
The Project
The Live Event Hub
The main project I tackled over the summer was the Live Event Hub. I contributed to the UX strategy, helped define what the leaderboard intelligence should look like, and shaped the personalization framework. I worked with two other product designers, alongside the whole product team.
The Problem
Accurate, and completely mute
The leaderboard gives you names and numbers, and nothing else. Nothing tells you who just birdied the last four holes, or who dropped 8 spots after a great start. On TV, the announcers keep you updated. Online, you are on your own.
Wherever they are
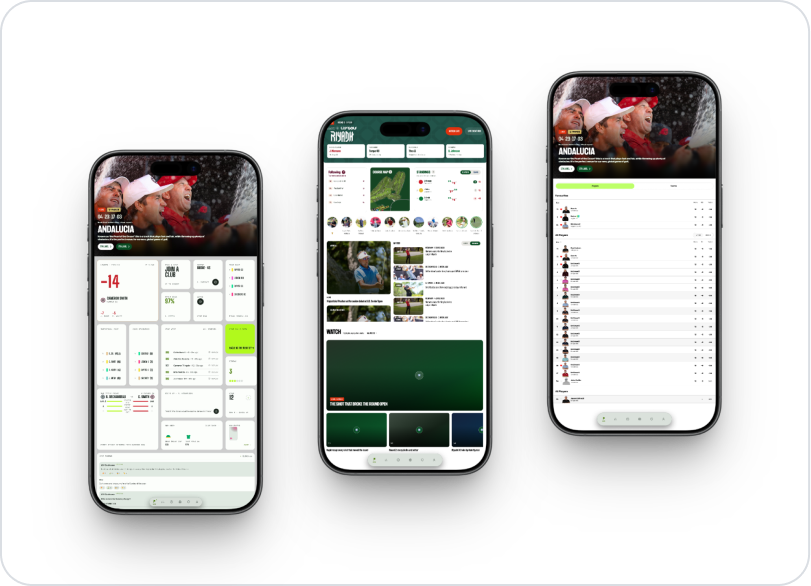
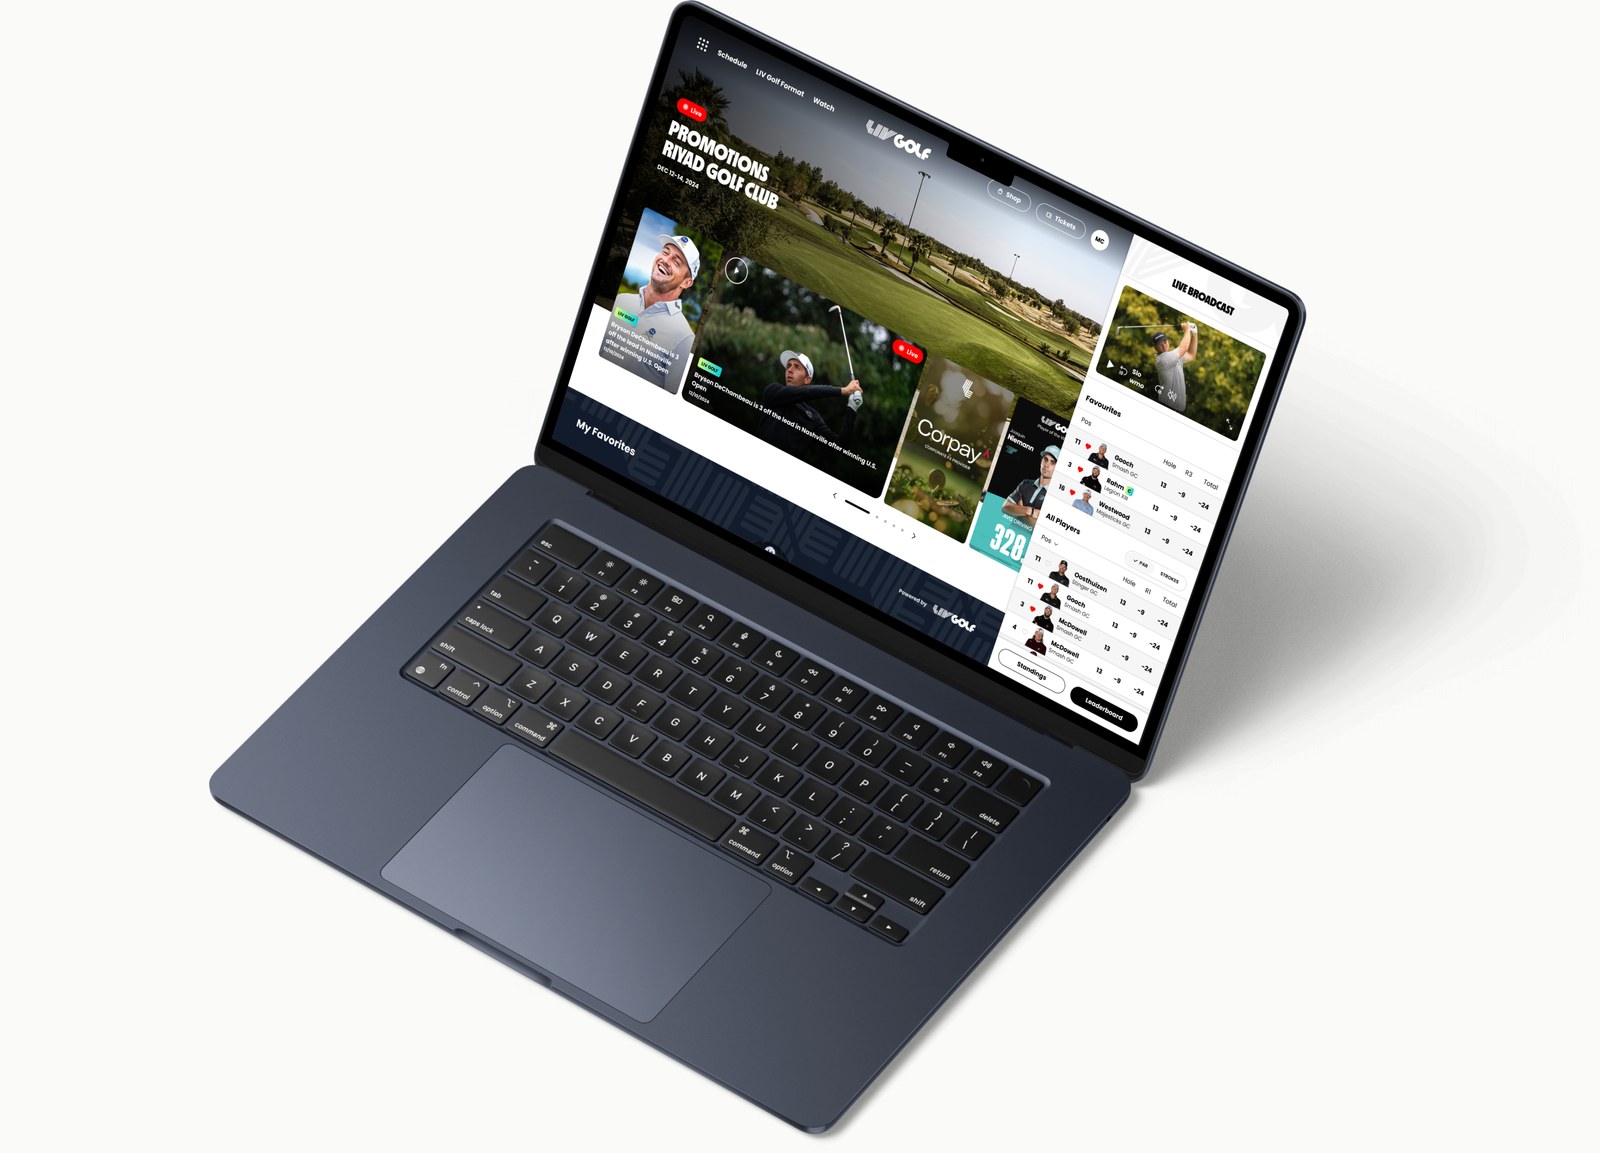
Fans can check in on the Live Event Hub from anywhere, being able to access from both mobile and desktop.
Insights from the PRD
Fans want more than the data. They want the story it implies.
The story is there, just behind all the data. There was no need to add more information. We just needed to personalize the way fans follow an event, wherever they are.
“For fans, it should feel like following a live sporting event through BBC Sport or Cricinfo rather than repeatedly refreshing a leaderboard.”LIV Golf PRD
“The next generation leaderboard should explain why it happened, what it means, and what is likely to happen next.”LIV Golf PRD
Planning Phase
LIV had a scoreboard. The brief was a hub.
LIV had one live leaderboard page. The Hub had to add a feed, shot tracking, standings and personalization without making the leaderboard feel taken away. It needed to read as that page growing, not a replacement.
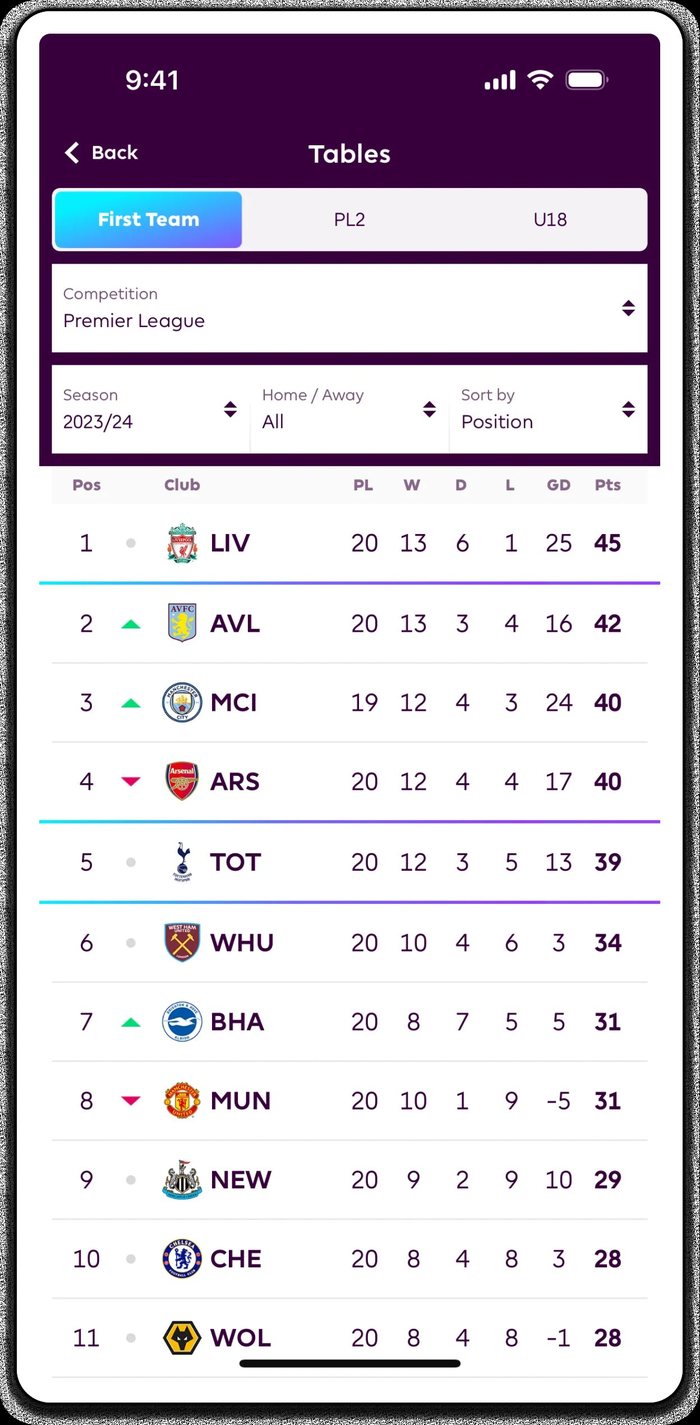
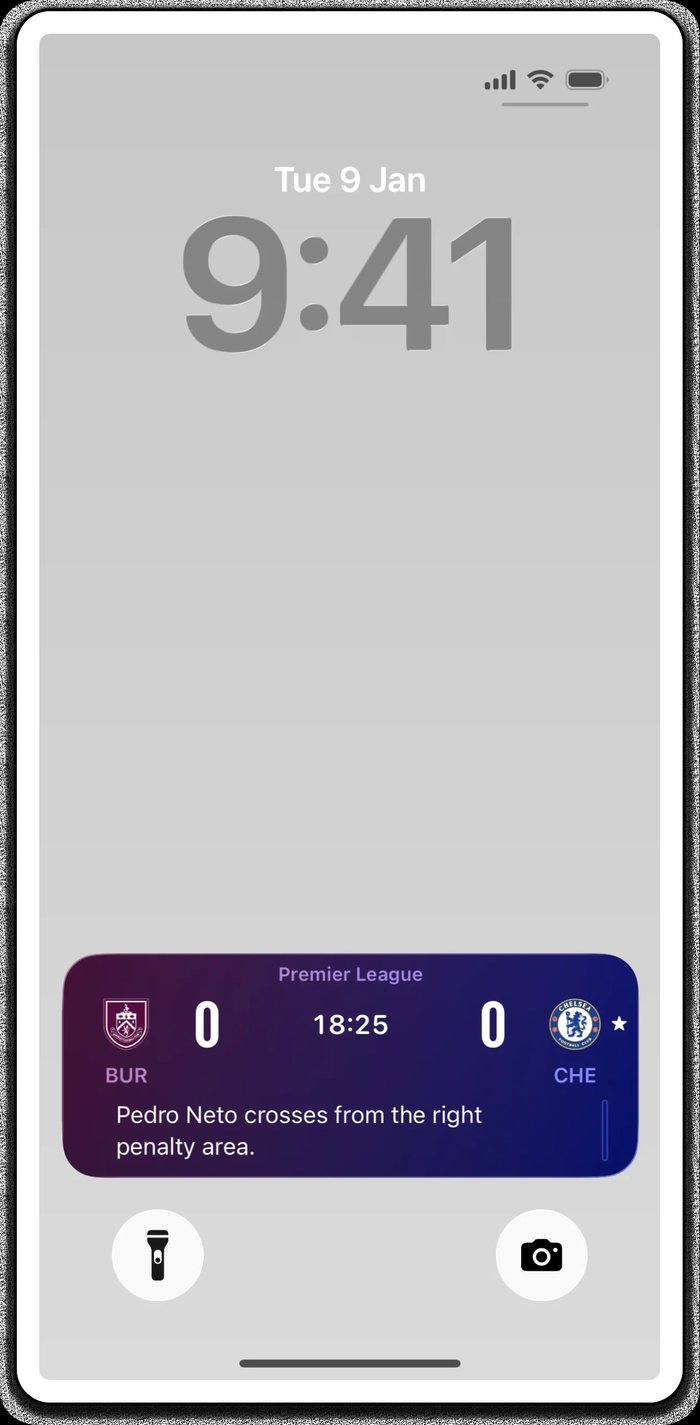
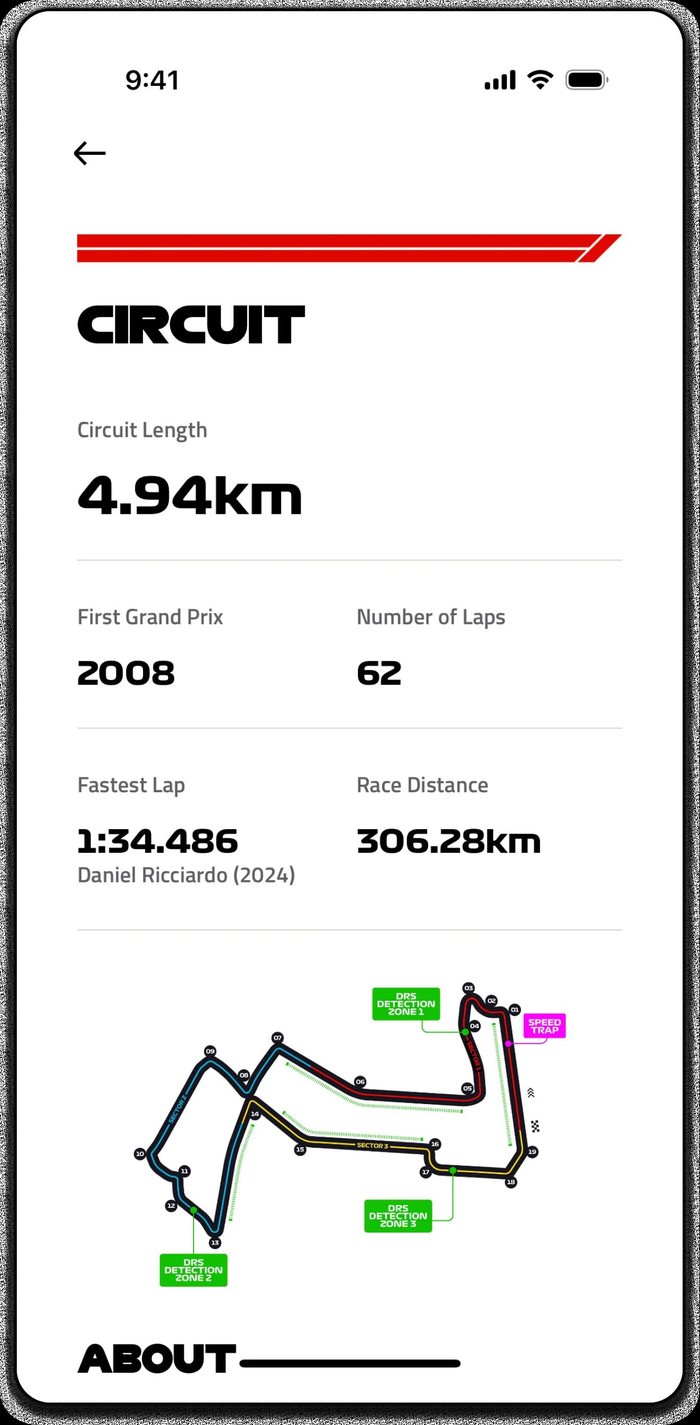
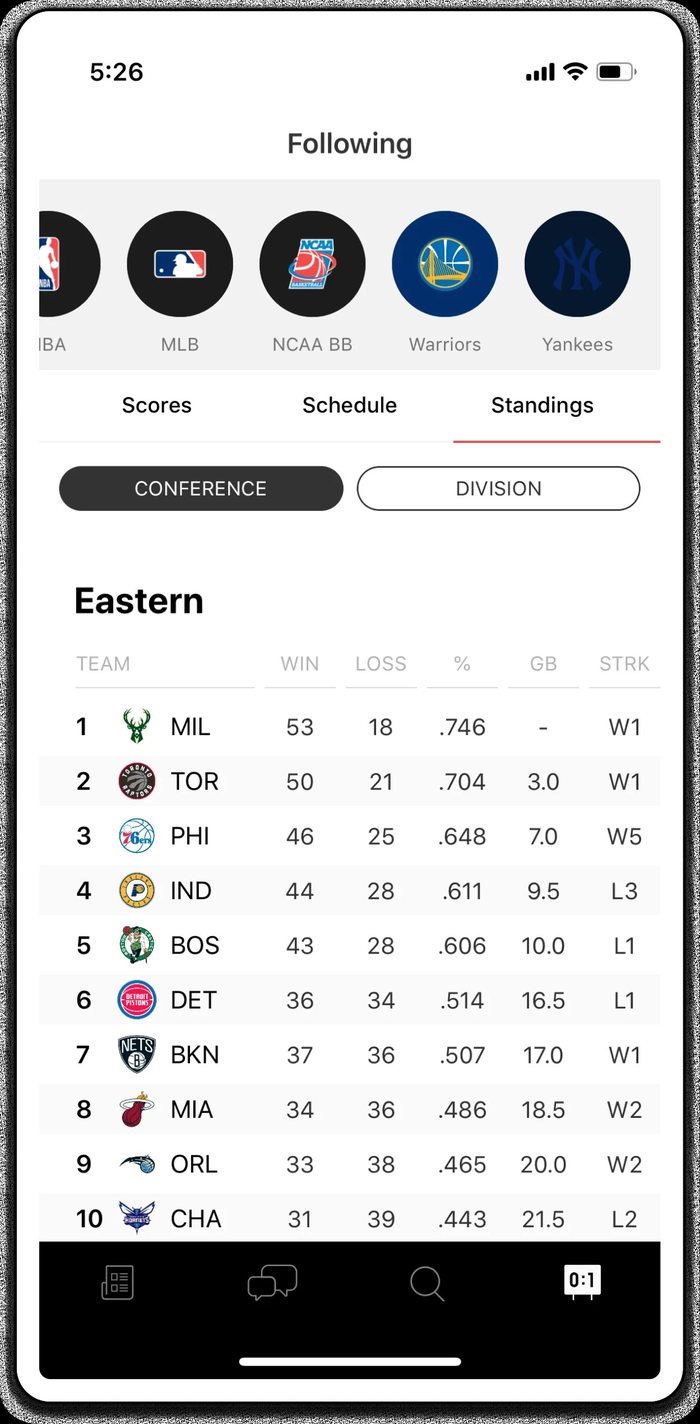
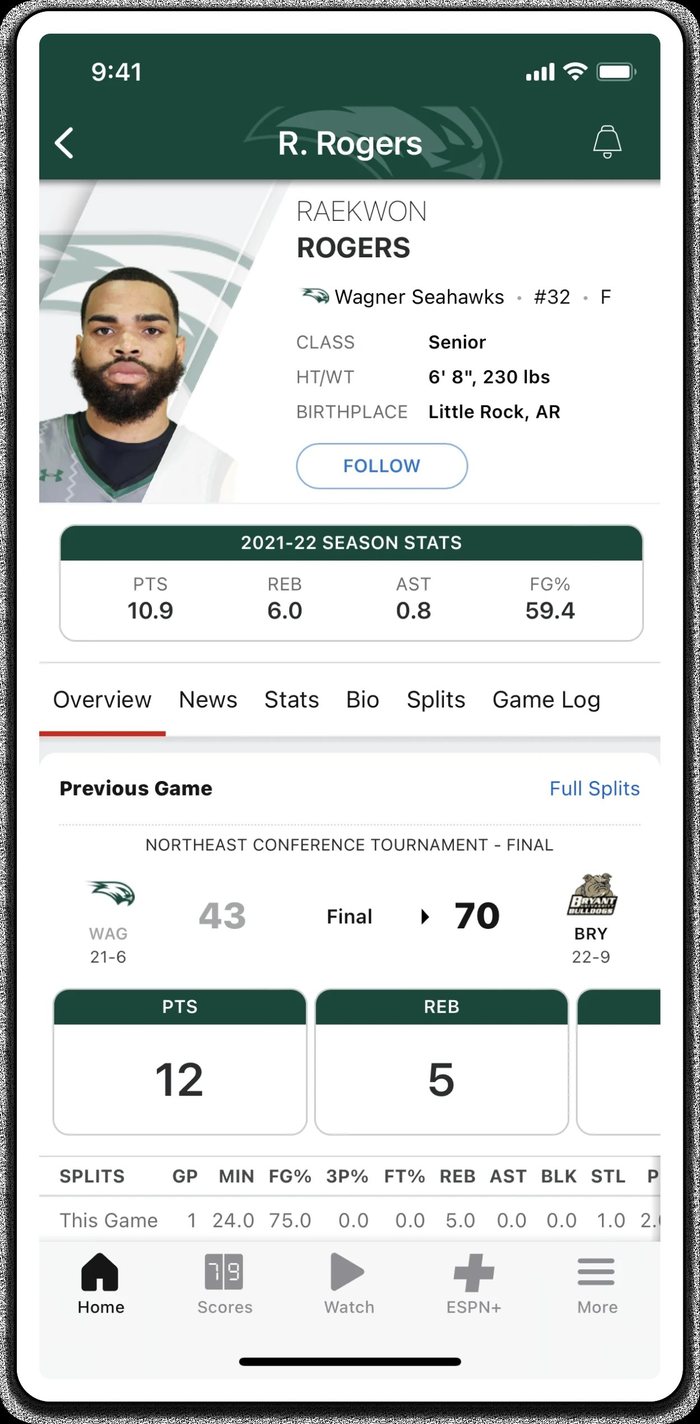
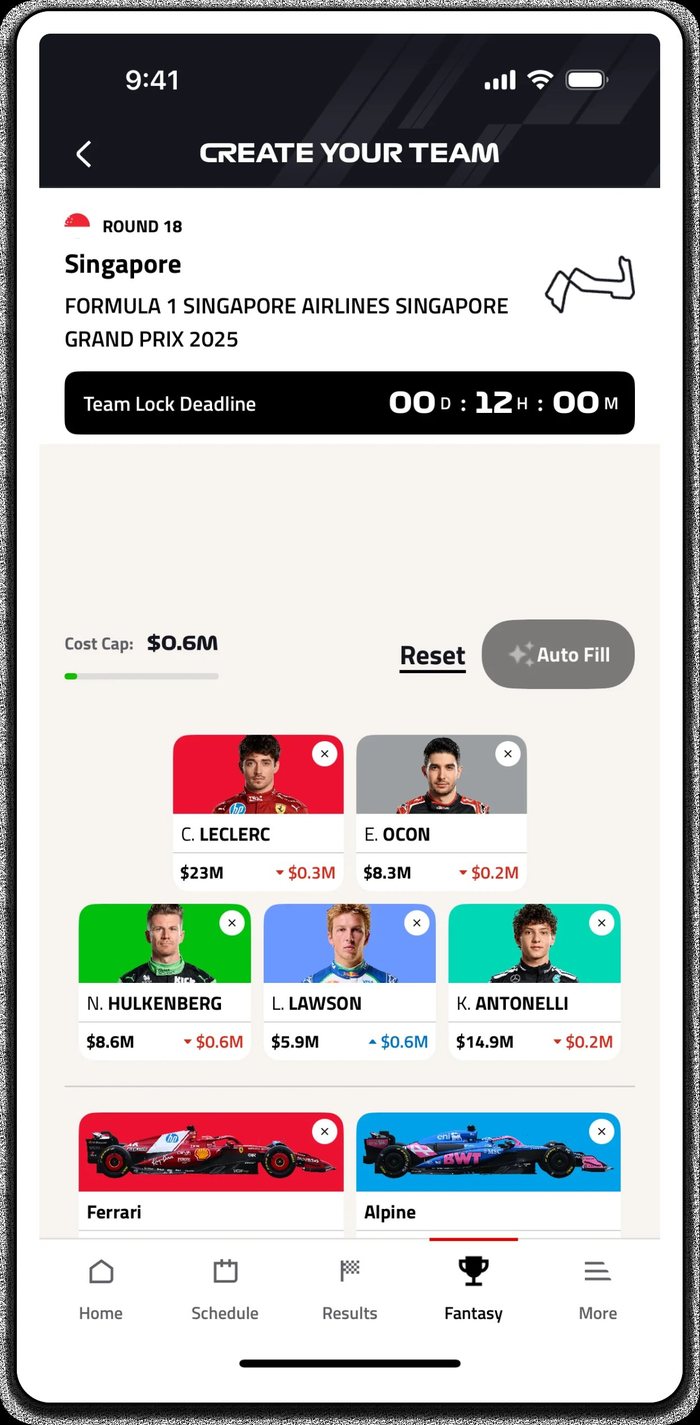
So we looked at products that had already solved pieces of it, one question at a time.
How do you show a field of players changing places?
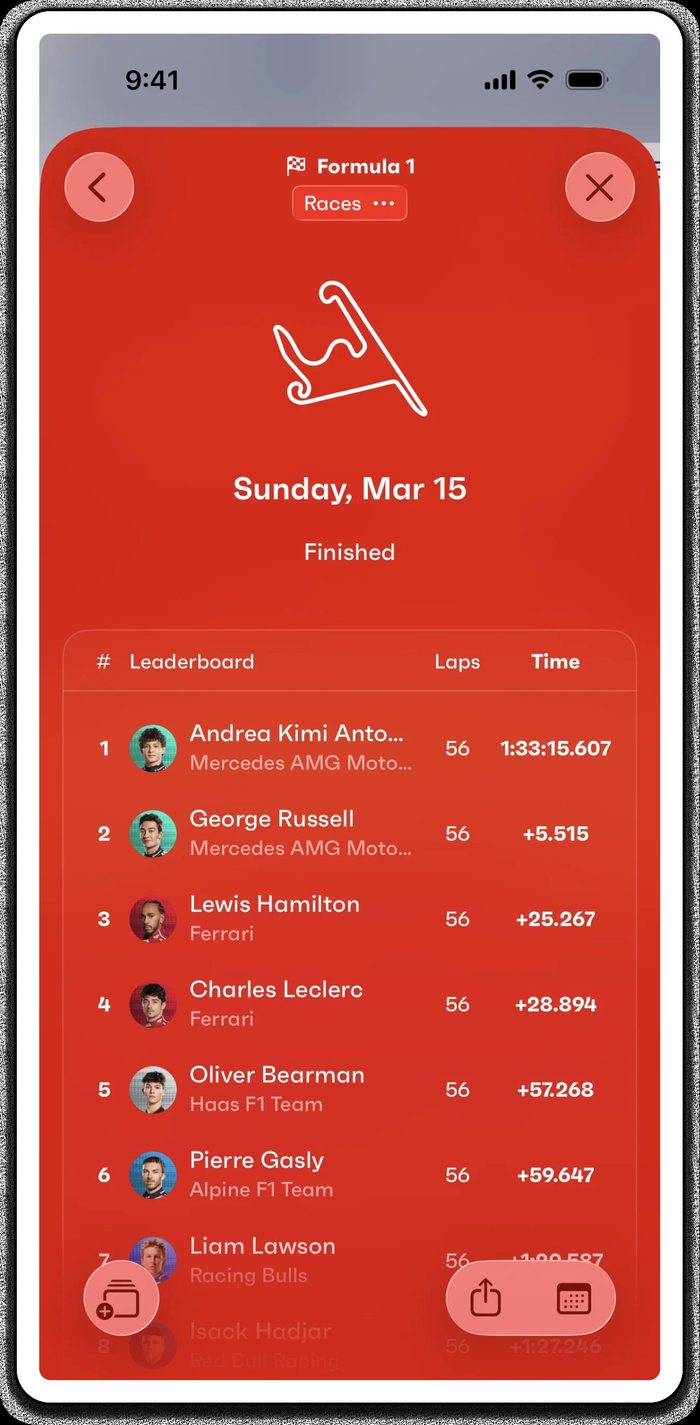
How do you turn play into something readable?
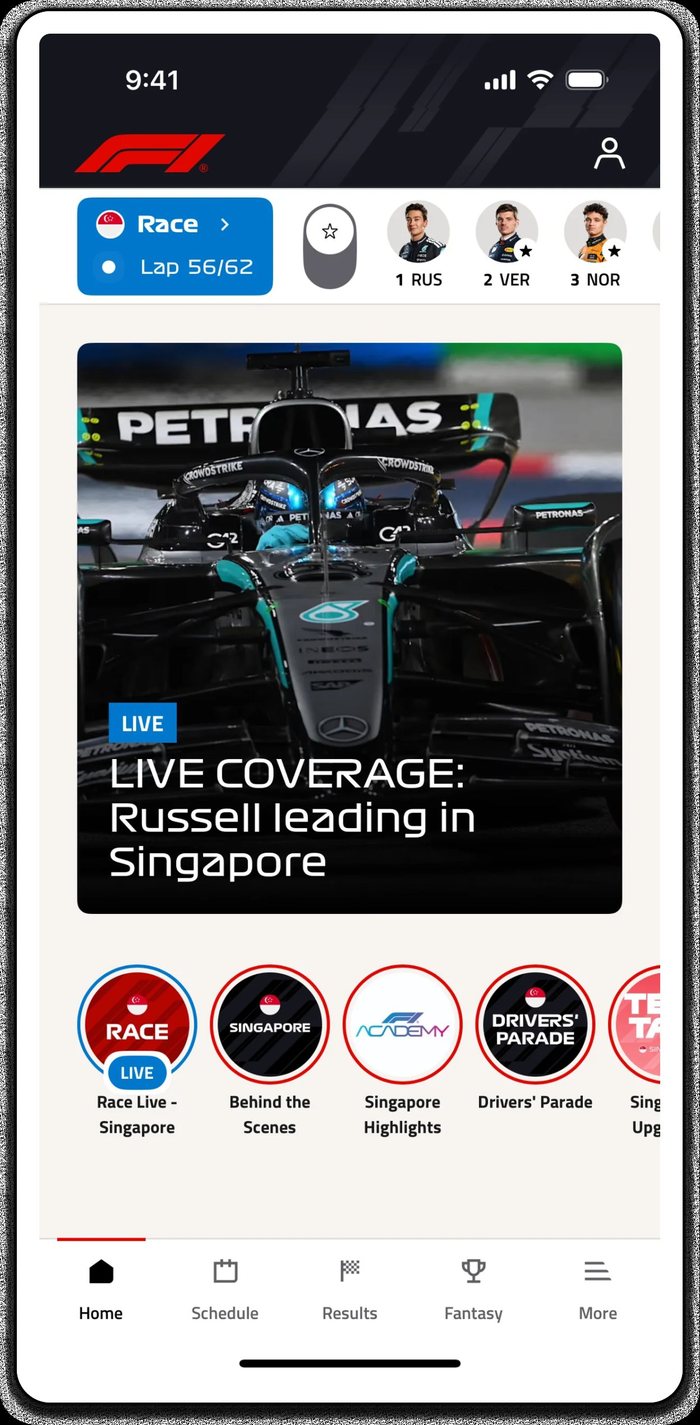
How do you get someone to tell you who they care about?
Reading a Scorecard
Four ways to read eighteen holes
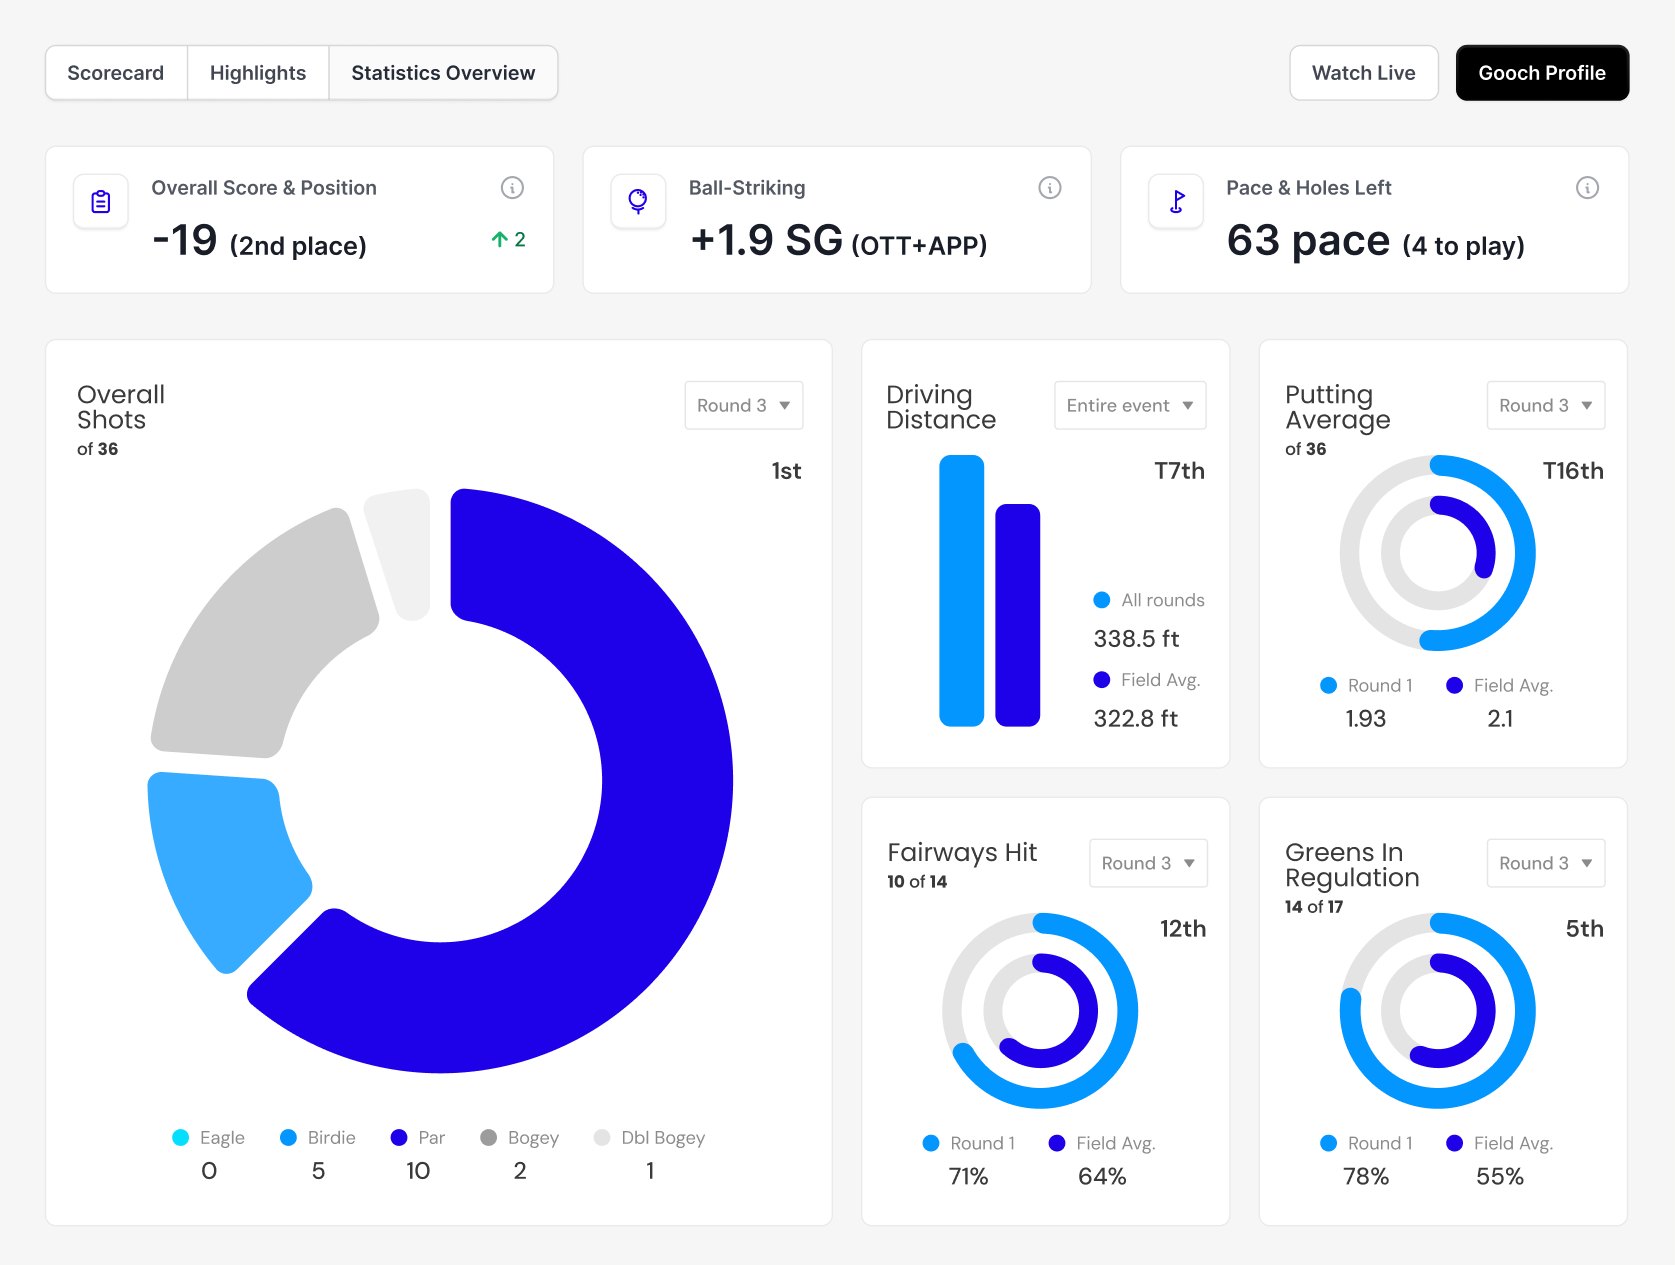
A scorecard is a grid of numbers that a fan is supposed to understand at a glance. I drew it four ways, from plain figures to structure to colour, and tested how fast each one gave up its story.
-
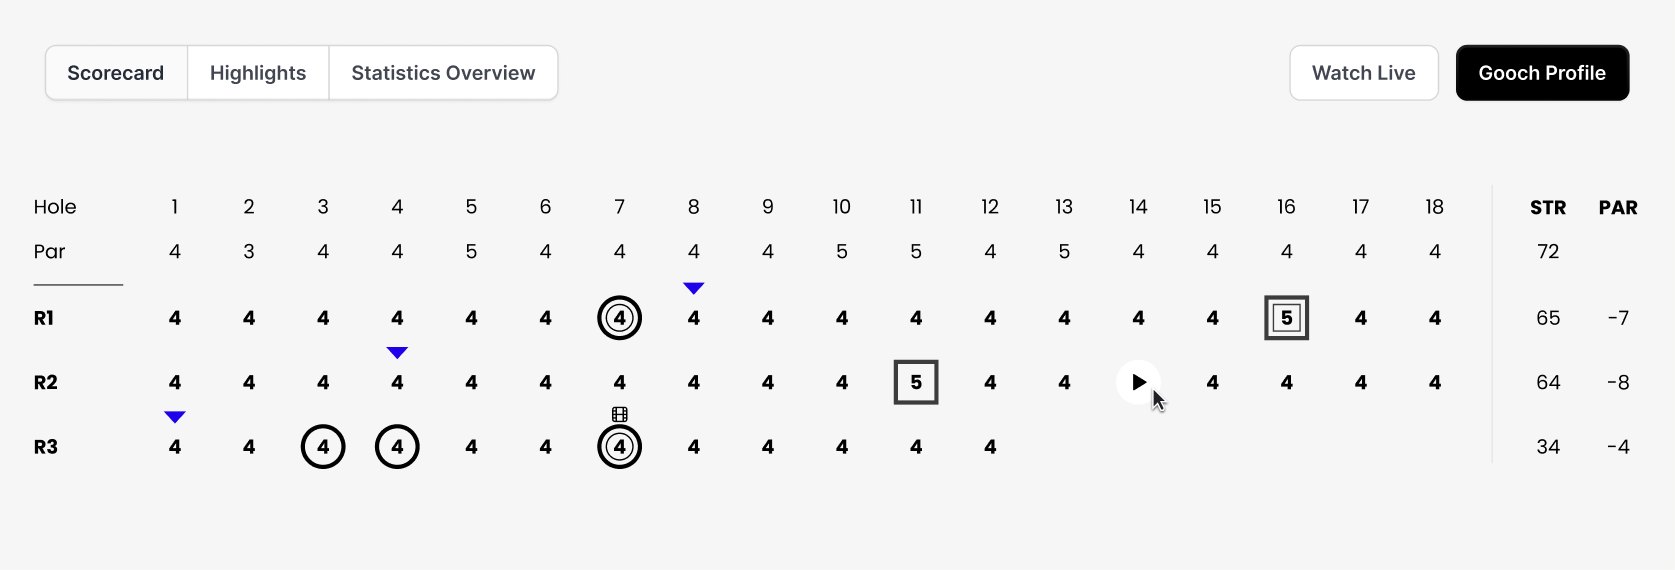
01 · Plain figures Par on top, three rounds below. Honest, and almost unreadable at a glance: every number carries the same weight.
-
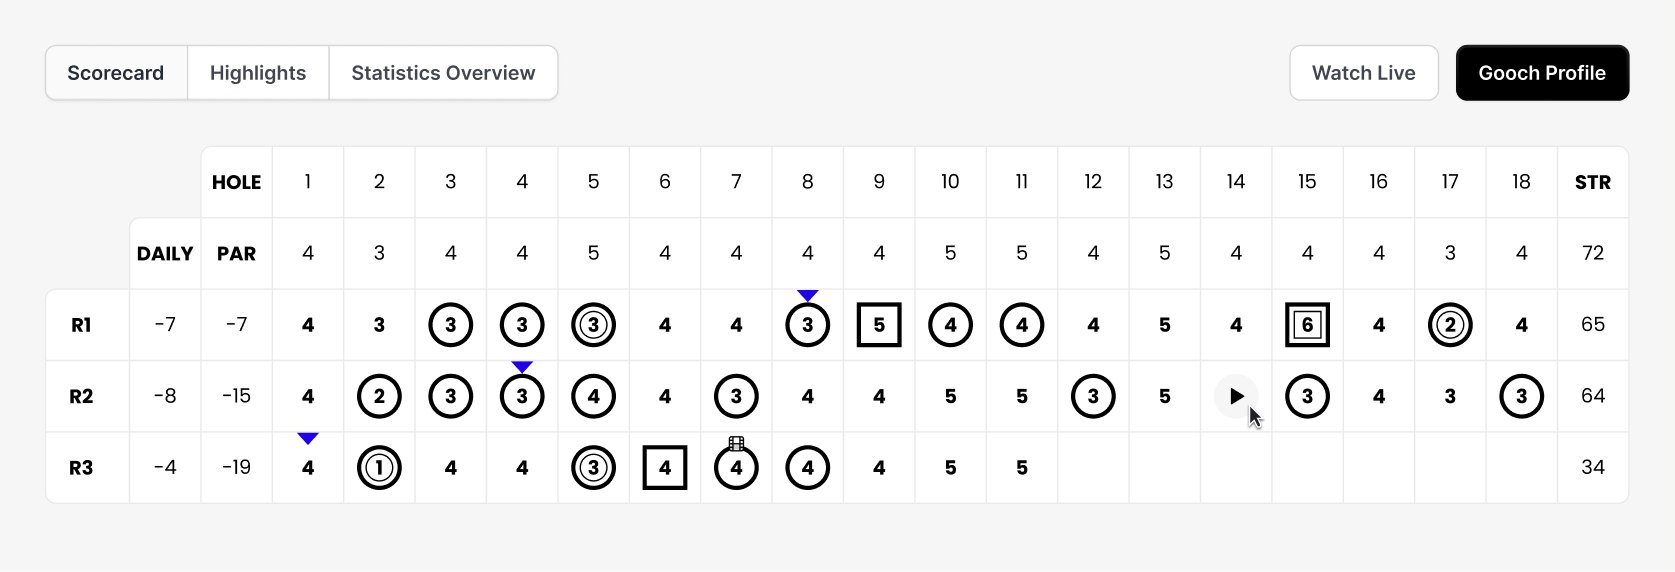
02 · Add structure Hole, par and a daily total get their own columns. You can find a round now, but you still have to read it.
-
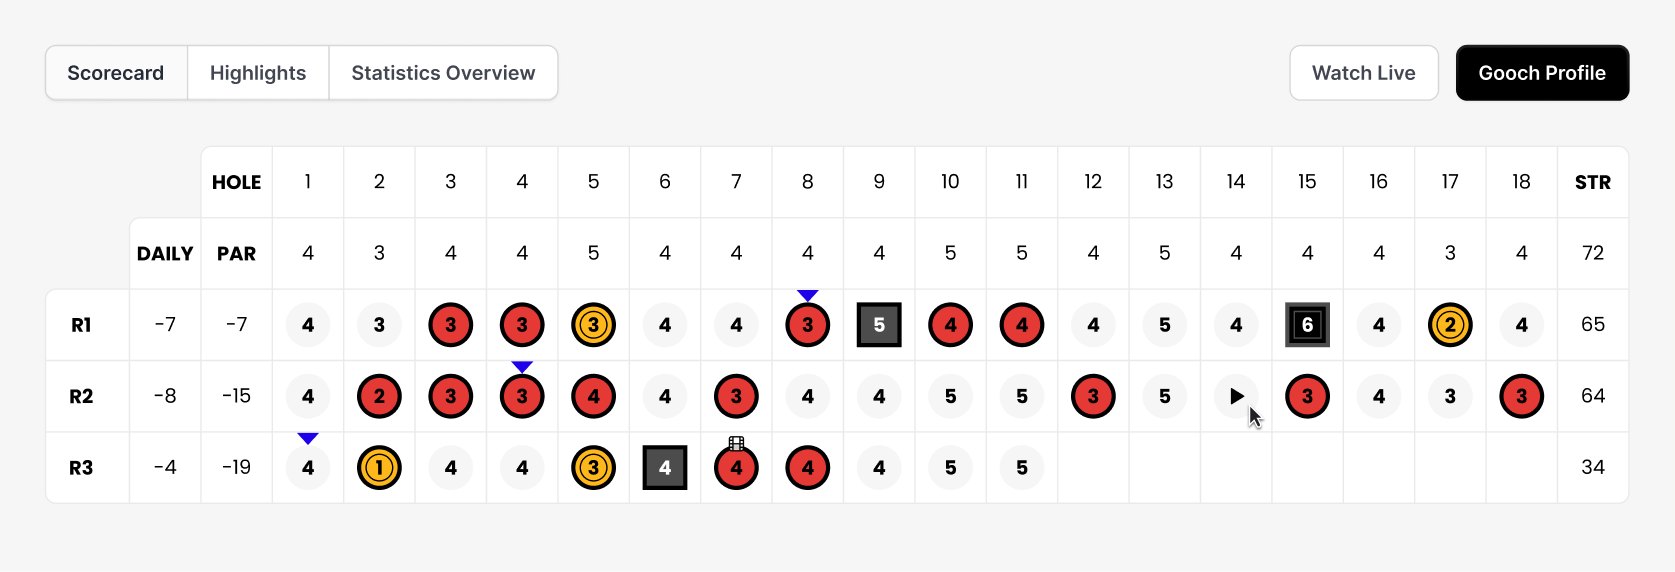
03 · Add colour Birdies and bogeys get filled. Suddenly the shape of a round is visible before you read a single figure. But it is loud.
-
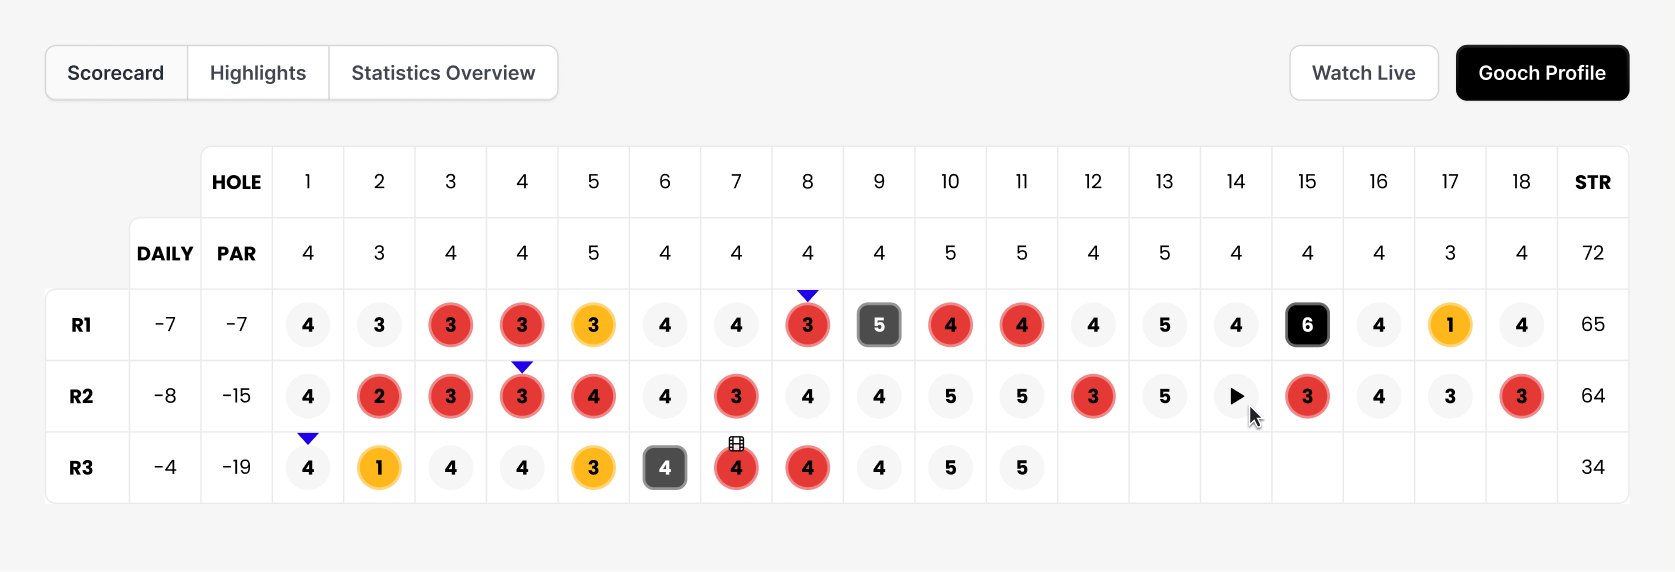
04 · Where I landed Same colour logic, dialled back. Colour does the scanning, the numbers stay legible underneath, and a bad hole still reads as a bad hole from across the room.
The Solution
What I solved
Leaderboard intelligence to tell a 3-hole story. Personalization to decide who and what you want at the top of your feed. A dual-scrolling news section, with main stories and the teams you like.
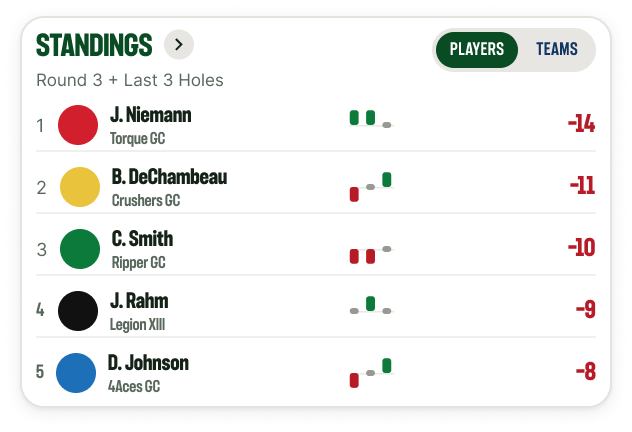
3-Hole Story
See what just happened
Tuning in for a quick glance while at your kid’s baseball game? See how the top performers on the leaderboard are playing through the last 3 holes.
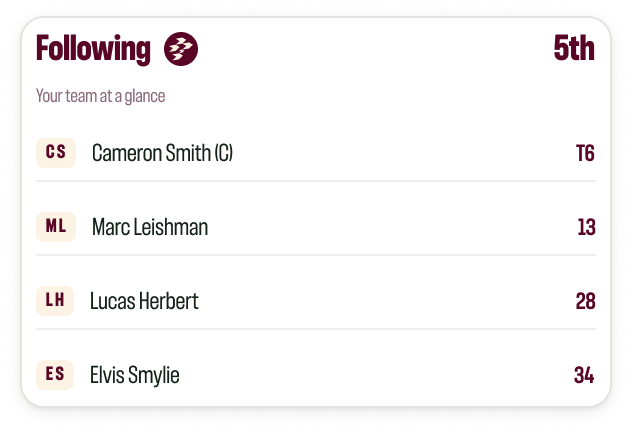
Following
Keep up with your team
Have a team you support throughout the season? Let’s make sure you can see where the team sits on the leaderboard, and how its players are doing.
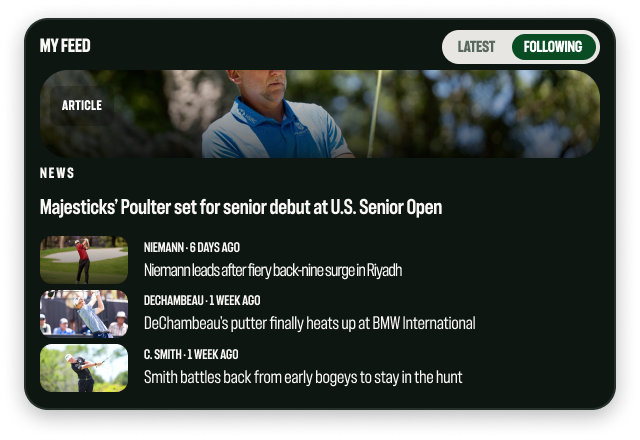
News
Two feeds, one place
LIV constantly has stories coming out about tournaments, players, and teams. Keeping up with all of it is a hassle. In the Live Event Hub, the dual-scrolling news and following sections fix that.
The Result
Not pushed
The CTO backed the direction, but nothing shipped, the company’s state was uncertain. The work will hopefully be there for the new business model with LIV 2.0.
Other Creative Work
Digital Marketing Campaigns
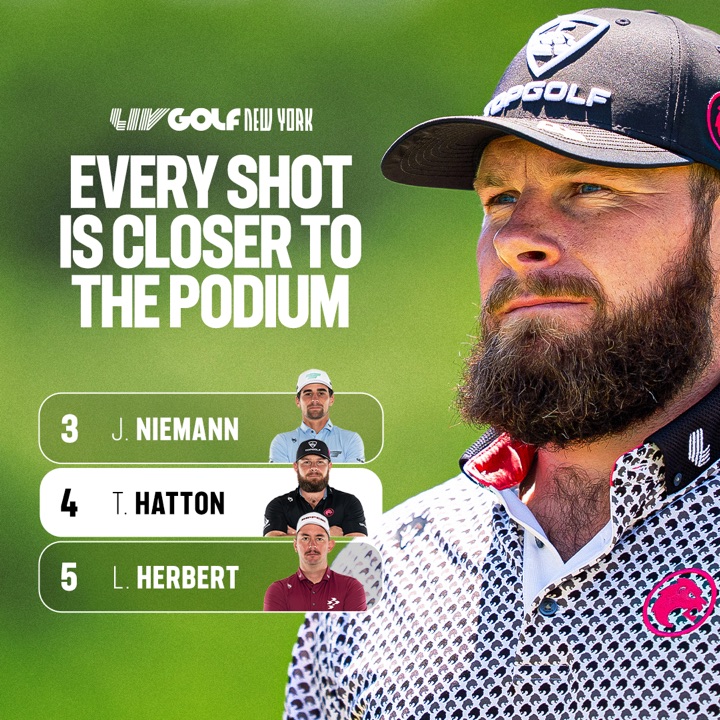
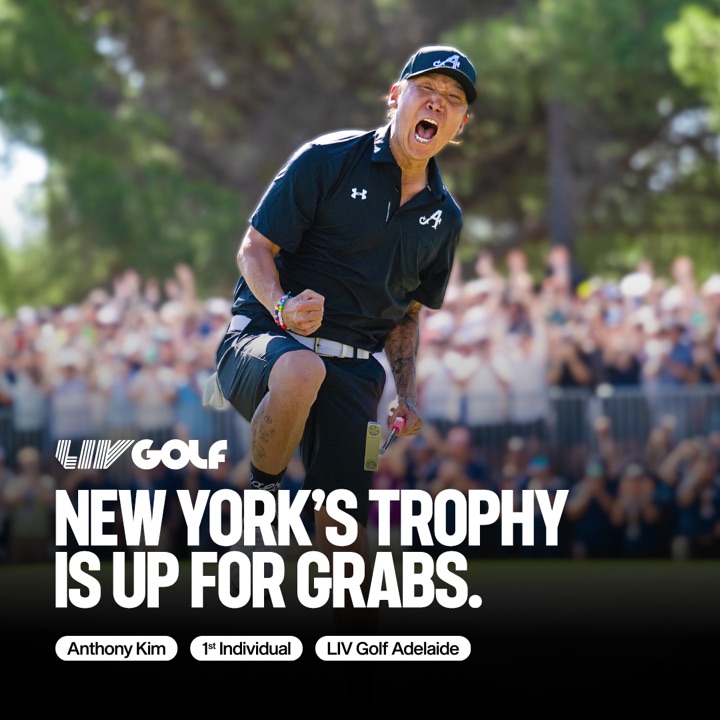
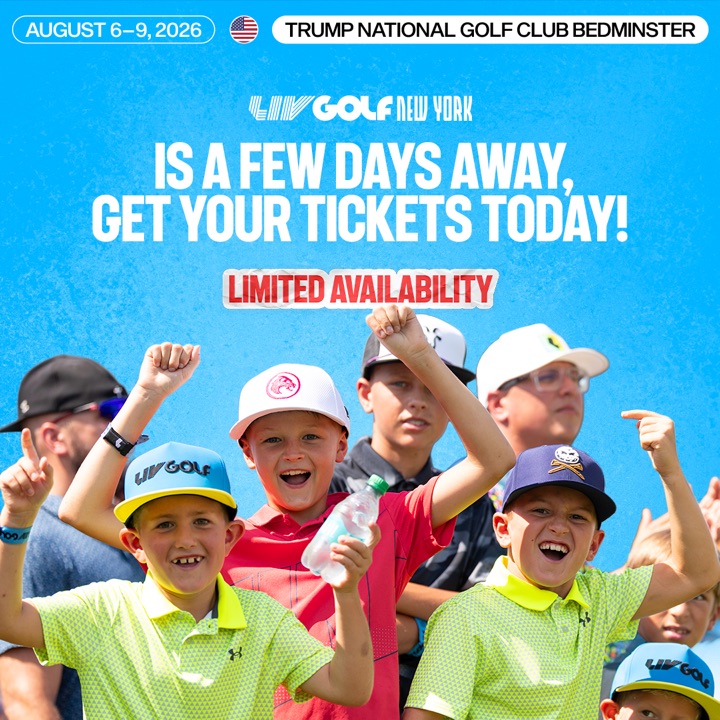
Alongside the product work, I worked with the digital marketing team to promote ticket sales for the LIV Golf NY event. I created assets that ran across paid social and display.
Video
Video for the New York event
I created several kinds of video creative: player spotlights, quick shorts, and promotional pieces. Working with the head of promos and a motion designer, I turned briefs around same-day.
Static
Directing the static campaign
Along with video, I led creative direction on static assets. I wrote and produced the briefs that the graphic designers executed.

Takeaways
What I learned this summer.
The small things matter a great deal at this level. In school, and at the smaller companies I worked for, the finished piece mainly had to be aesthetically pleasing. Here, it had to perform. My work was seen by millions, and any one of them could notice a small error that a professor would only have flagged in the margin. This changed how I work: details became the priority, because they are what deliver the best experience to the fan. It was also my first time designing within a large-scale design system, and by the end it was what let me move quickly while keeping every touchpoint on brand.